ear-end city housing starts statistics for 2019 recently became available from Canada Mortgage and Housing Corporation (CMHC). For the six largest cities in Canada, by population, this article will examine how last year’s results compared with other years, previous peaks and long-term averages. It will also look at the singles-versus-multiples mix.
Multiple-Unit Starts Now Totally Dominate Montreal’s Marketplace
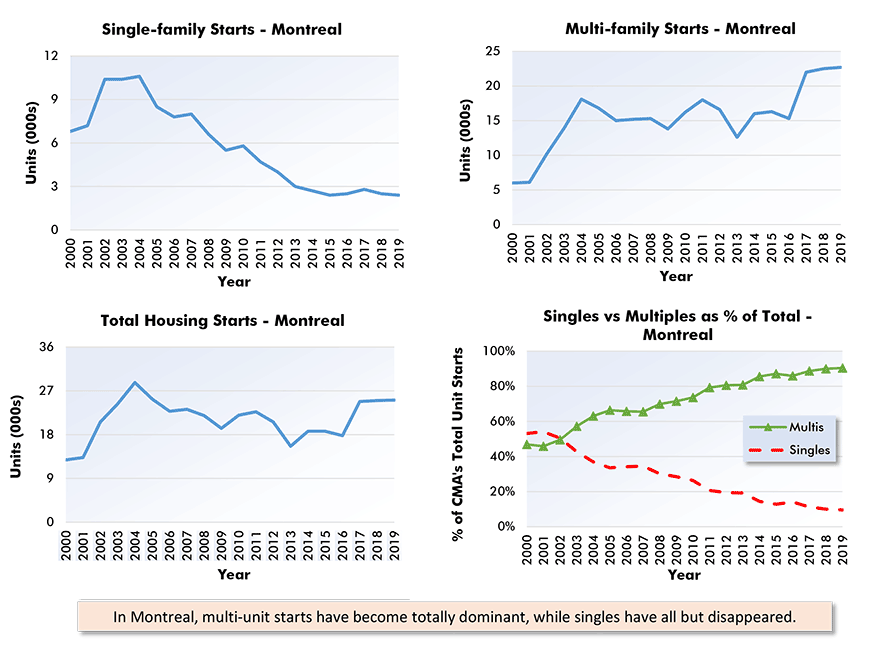
Montreal’s total housing starts in 2019, at 25,100 units, were little changed from either the year prior, 25,000 units, or two years earlier, 24,800 units. 2019’s year-over-year ‘total’ percentage change was +0.4%, with a dip in single-unit groundbreakings (-4.0%), but an uptick in multiple-unit initiations (+0.9%).
The smaller positive percentage change for multiples yielded a slightly greater net count of units than the larger negative percentage change for singles because the number of multiple-unit starts in the city now so far exceeds the number of single-unit starts.
The bottom right chart in the accompanying graphic for Montreal shows the dramatic fashion in which the gap in the shares taken by multiples and singles has grown ever wider since 2002. It has become about as exaggerated as is mathematically possible. Multiple-unit starts in the city in 2019 were 90.6% of the total, with singles at less than 10.0%.
Montreal’s 25,100 units in 2019 may have been relatively healthy compared with most other years this century, but they were considerably below the all-time peak for the city of 42,000 units attained in 1987.
Just the same, 25,100 units does compare favorably with the latest 10-year annual average figure of 21,100 units. The latest 10 years corresponds with the period since the 2008-09 recession.
Statistics Canada publishes a new housing price index (NHPI). It’s for singles, semis and townhouses, but not apartment and condominium towers. Montreal’s NHPI in December 2019 was +6.6%.
For insight into actual house prices in Montreal, one good option is to turn to the median sticker prices for existing homes provided (in a price map at their website) by the Canadian Real Estate Association (CREA). In December 2019, the Montreal median resale home price was $382,000, +9.4% y/y.
Graph 1: Montreal Housing Starts
Data source: Canada Mortgage & Housing Corporation.
Chart: ConstructConnect.
A Hot New Homes Market in Ottawa-Gatineau in 2019
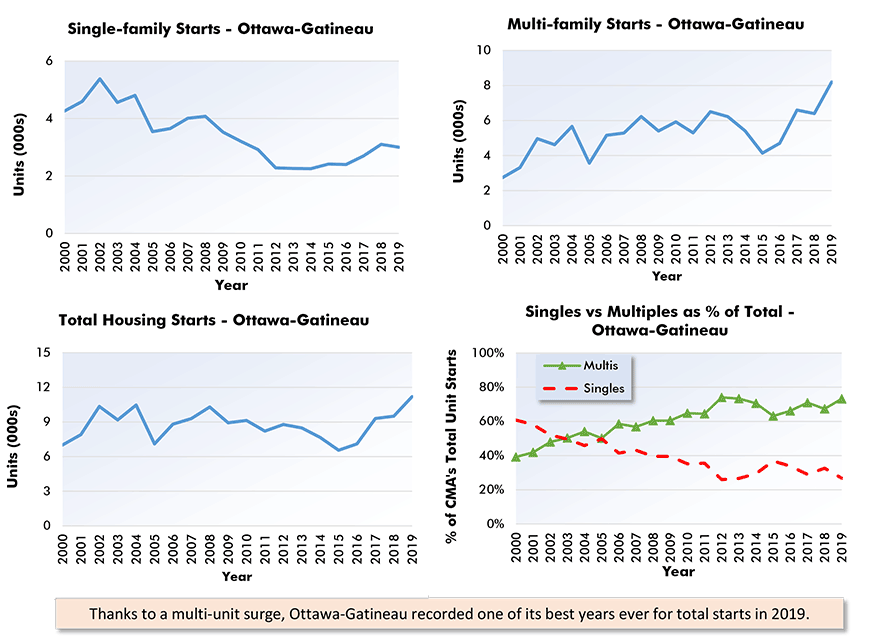
Ottawa-Gatineau, in 2019, had its best year for total housing starts this century, 11,200 units. The average for the nation’s capital over the last ten years has been a lesser figure of 8,600 units. But the all-time peak was 15,500 units, arrived at nearly 50 years ago in 1973.
Last year’s total unit starts were +17.9%, led by multiples at +28.1%, whereas singles stumbled slightly, -3.2%.
As in other major urban centers in Canada, housing starts in Ottawa-Gatineau are increasingly leaning towards multiples as opposed to singles. In 2019, the former comprised 73.2% of the total and the latter, only 26.8%.
Statistics Canada’s new housing price index (NHPI) for Ottawa-Gatineau registered positive increases on both sides of the river separating Quebec’s residences from Ontario’s. New home prices on the Quebec side were +3.2% y/y. On the Ontario side, they were livelier, at +7.2% y/y.
In addition to its new homes price index, which is monthly, Statistics Canada also publishes a residential property price index (RPPI) series, which is quarterly. The RPPI has an expanded scope of coverage versus the NHPI, as it includes condominium and apartment towers.
In Q3 2019, the Ontario side of Ottawa-Gatineau had an RPPI figure for new condos and apartments that was +16.3% year over year, demonstrating a notable strength in demand for such dwellings.
On a final note for the city, and switching focus to existing homes and their prices, the Canadian Real Estate Association (from its website pricing map) has resales on the Ontario side of Ottawa-Gatineau going for a median value of $447,000 (+12.5% y/y), and on the Quebec side, for $285,500 (+5.5% y/y).
Graph 2: Ottawa-Gatineau Housing Starts
Data source: Canada Mortgage & Housing Corporation.
Chart: ConstructConnect.
Housing Starts in Toronto in 2019 Plunged
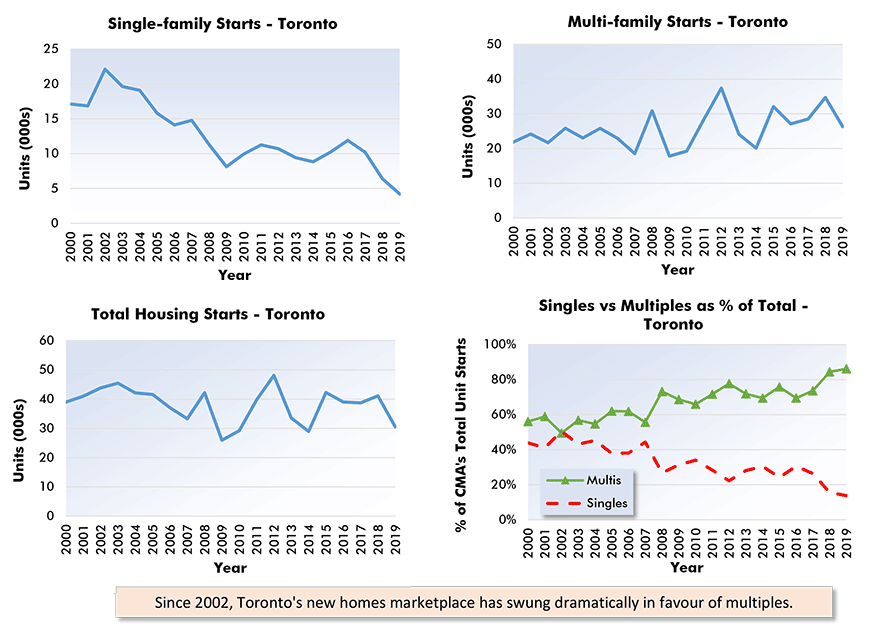
New home starts in Toronto last year fell off a cliff. In ‘total’, they were down by a quarter, -25.8%. Multiple-unit starts were also lower by about a quarter, -24.2%, while foundation work for new single-family structures retreated by more than one-third, -34.4%.
In a clear demonstration of Toronto’s giant-sized housing market, however, the city’s total number of starts last year, despite a 25.8% drop, was still the highest in the land, at 30,500 units compared with second-place Vancouver’s 28,100. Montreal was third with 25,100 units.
Toronto’s population last year rose to an astonishing degree, by 125,000 individuals, and they all needed living quarters. The longer-term outlook for Toronto housing starts can only be upbeat.
At 30,500 units for total starts in 2019, the all-time high for the city of 48,100 units, achieved in 2012, was in no danger of being beaten. Furthermore, the annual average for total starts in the city over the past decade of 37,100 units wasn’t reached either.
Multiple-unit starts in Toronto, as a share of ‘total’, have now climbed to 86.2%. No wonder construction cranes, building high-rise condo towers, can be seen everywhere in TO, as the city is known by locals.
The December 2019 year-over-year percentage change in Statistics Canada’s new housing price index for Toronto was -0.7%.
Finally, as for the price level of residences in Toronto, CREA has calculated a median figure of $819,700 for resale homes, +7.3% y/y.
Graph 3: Toronto Housing Starts
Data source: Canada Mortgage & Housing Corporation.
Chart: ConstructConnect.
Calgary’s New Home Starts in 2019 a Match for 10-Year Average
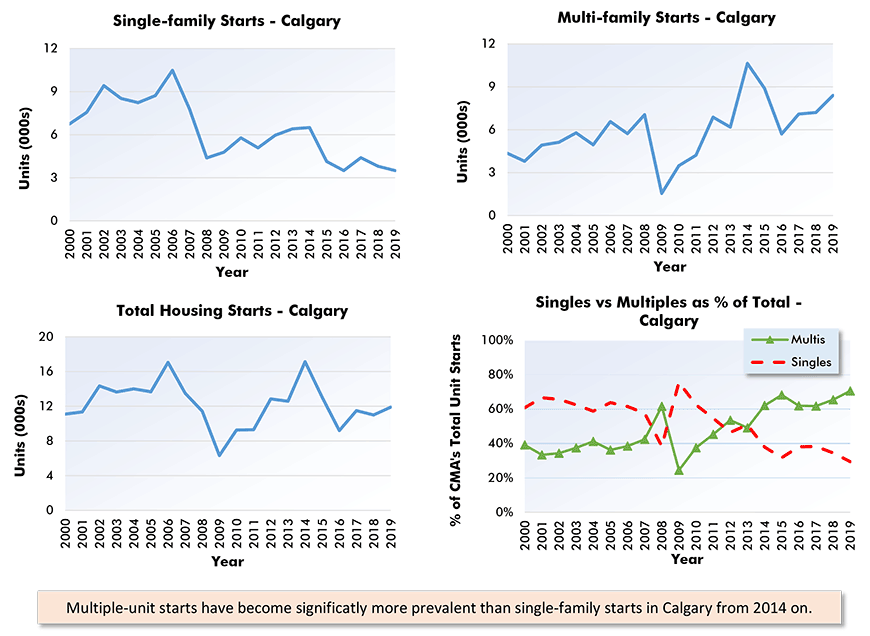
In 2019, Calgary’s housing starts were 11,900 units, an almost exact match for the city’s annual average of 11,800 units over the past ten years. Worth noting is that the past ten years also corresponds with the period since the 2008-09 recession.
On a year-over-year basis, Calgary’s annual total of 11,900 last year was +8.2%. Single-family starts faltered, -7.9%, but multi-family starts more than made up the slack, +16.7%.
As for how 2019 compared with Calgary’s best annual level, there were twin peak years in the city of slightly more than 17,000 units in both 2006 and 2014.
Multiples as a share of ‘total’ in Calgary last year were 71%. Multiples have been clearly predominant versus singles in the city since 2014.
Statistics Canada’s new housing price index for Calgary in December 2019 was -2.2% y/y.
With respect to residential resale (i.e., as opposed to ‘new’) property in Calgary, CREA’s median prices map records a figure of $413,000 in December 2019, -1.4% compared with December 2018.
Graph 4: Calgary Housing Starts
Data source: Canada Mortgage & Housing Corporation.
Chart: ConstructConnect.
Edmonton Sees Slight Uptick in Housing Starts in 2019
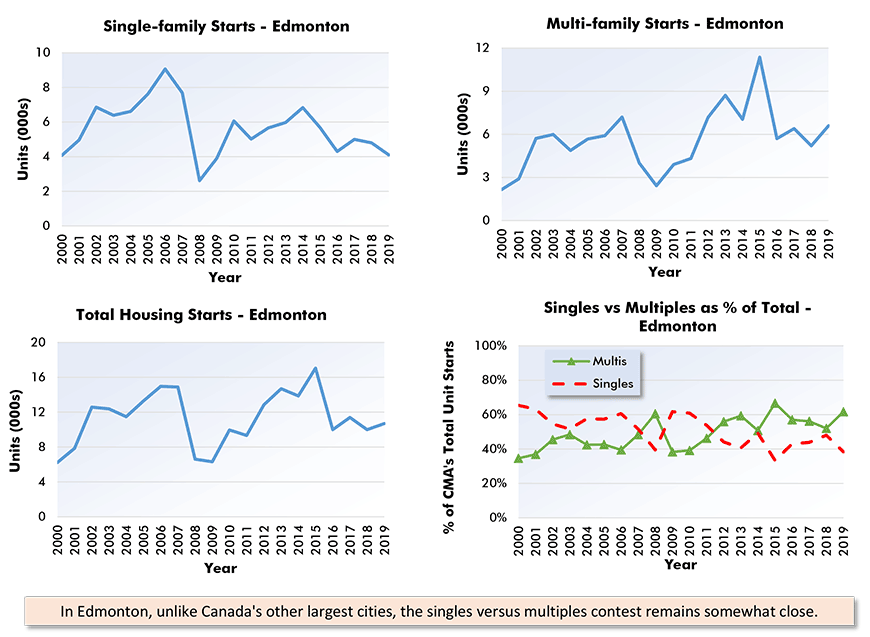
Edmonton’s total housing starts last year, at 10,700 units, were a little under the city’s annual average of 12,000 units over the past decade. Nevertheless, they were +7.0% year over year, thanks to a big gain in multiples, +26.9%, that more than offset a pullback in singles, -14.6%.
Edmonton’s latest annual level of housing starts, at less than 11,000 units, was well under the 17,100-unit record high attained four years ago in 2015 and, also, way back in 1978. (It’s remarkable that Alberta’s two primary cities, Calgary and Edmonton, possess the same annual peak levels of housing starts, 17,100 units.)
Multiples as a percentage of total unit starts in Edmonton last year were 62%. Edmonton remains the only city among Canada’s six most populous where singles are still competitive with multiples for dominant portion of the total.
Statistics Canada’s new housing price index for Edmonton in December was -2.2% y/y, the same as for Calgary.
Stepping away from the new homes market, CREA has calculated that the median price of a resale home in Edmonton in December 2019 was $312,400, -2.1% y/y.
Graph 5: Edmonton Housing Starts
Data source: Canada Mortgage & Housing Corporation.
Chart: ConstructConnect.
Vancouver 2019 Housing Starts Set New Record High
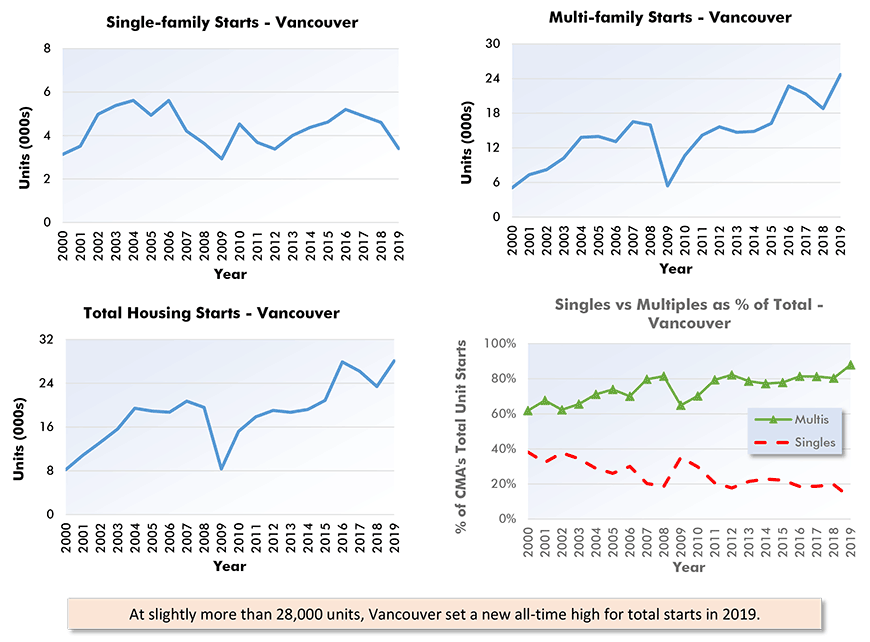
Vancouver managed exceptional strength in total housing starts in 2019. The city’s annual level last year of 28,100 units was a new record high, surpassing ‒ although only barely ‒ the previous peak of 27,900 units achieved in 2016.
The year-over-year increase in total starts of +20.1% resulted from a sharp climb in multiples, +31.4%, that overcame a steep reversal in singles, -26.1%.
Multiple-unit starts in Vancouver in 2019 were 88% of total-unit starts. Vancouver has a long history of multis taking a greater share of all starts than singles.
Statistics Canada’s new homes price index for Vancouver in December 2019 was -2.3% y/y.
As for the existing homes market in the city, CREA has calculated the median price of a resale property in Vancouver to be $1,001,000 in December 2019, -3.1% versus December 2018.
Graph 6: Vancouver Housing Starts
Data source: Canada Mortgage & Housing Corporation.
Chart: ConstructConnect.
